
Bringing Ocean Conditions to the Lab: Building Realistic Phytoplankton Communities for mCDR Testing
At Gigablue, we're not just theorizing about Marine Carbon Dioxide Removal (mCDR)—we're meticulously testing and refining it. Our commitment to environmental safety and high-quality carbon removal means rigorously evaluating our solutions under conditions as close as possible to our target deployment areas, especially the challenging sub-Antarctic High-Nutrient, Low-Chlorophyll (HNLC) seawater.
A crucial part of this is understanding and accurately representing the local phytoplankton community is crucial. Replicating the intricate dance of ocean chemistry, physics, and microbial ecology in a controlled lab setting demands precise study design, meticulous planning, and effective resource management.
That's why we've developed a method for selection and acclimation of phytoplankton species in our lab, ensuring our experiments reflect real-world conditions as much as possible:
Research: Characterizing the Real Ocean
Cultivation & Acclimation: Building a Representative Community
Experimentation: Testing with Real-World Fidelity
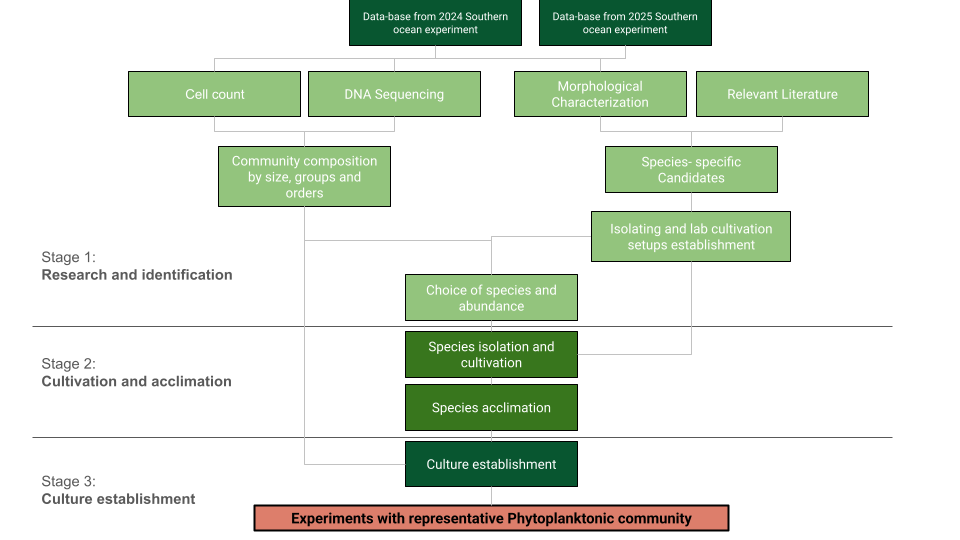
Figure 1: Logical flow chart of species selection process for ocean phytoplankton community illustration.
1. Research: Characterizing the Real Ocean
Our journey begins with gathering extensive data from our oceanic experiments and relevant scientific literature. This stage is all about deeply understanding the target phytoplankton community. We characterize species by taxonomy, morphology, size groups, and abundance using cutting-edge tools:
DNA Sequencing: Our May 2024 Southern Ocean experiment yielded valuable eDNA analysis from Cawthron, providing incredible insights into the diverse phytoplankton groups thriving in these waters.
Flow Cytometry & Microscopy: Data from our February 2025 New Zealand experiment shed light on the cell sizes and species composition.
This rigorous data processing allows us to compile a focused list of candidate species, prioritizing those that can be successfully cultured in a laboratory environment.
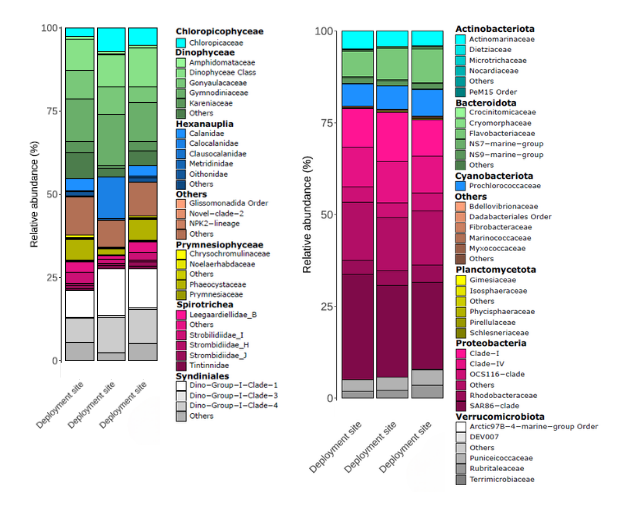
Figure 2: Taxonomic composition and relative abundance at the class (indicated in bold) and family levels per sample obtained from the 18S eukaryote metabarcoding and 16S bacterial metabarcoding. Each sample is represented by a vertical bar. For simplicity, less abundant taxa have been grouped into ‘others’ categories to facilitate visualization. Provided by Cawthron (1).
2. Cultivation & Acclimation: Building a Representative Community
Once we have our candidate species, the next step is cultivation. The growth of these selected species under optimal lab conditions (nutrients, light, temperature) will concede the establishment of viable cultures.
Over the next period, these cultures undergo a critical acclimation process. Their environment has to be gradually adjusted to simulate the unique, micronutrient-limited conditions of sub-Antarctic HNLC zones. This step is vital for ensuring the phytoplankton's physiological state accurately reflects and represents our target environment, making our lab experiments truly relevant.

Figure 3: Microscope image of various phytoplankton species from the target area during February 2025 New Zealand experiment.

Figure 4: Fluorescence microscopy image of various phytoplankton species cultivated in the lab.
3. Experimentation: Testing with Real-World Fidelity
Finally, with acclimated species in hand, a representative phytoplankton community is being composed. This community simulates the abundance and size distributions we identified in our initial research stage. This meticulously prepared community is then ready to interact with Gigablue substrates in our lab experiments, providing us with invaluable data on carbon accumulation rates and the overall mCDR technological efficiency under realistic conditions.
This scientific rigor, from geo-optimization for sampling to the methodical lab acclimation, is what enables Gigablue to develop mCDR solutions with the highest fidelity to real-world ocean processes.
References:
Saenz-Agudelo, P., & Thomson-Laing, J. (n.d.). eDNA analyses of water and particle samples from a controlled experiment: second phase (Cawthron Report No. 4124). Cawthron Institute.